
|
Detection of crop stress is one of the major applications of hyperspectral remote sensing in agriculture. Many studies have demonstrated the capability of remote sensing techniques for detection of nutrient stress on cotton with only few on pest damage but none so far on leafhopper (LH) severity. Subsequent to introduction of Bt cotton, leafhopper is emerging as a key pest in several countries. In view of its wide host range, geographical distribution and damage potential, a study was initiated to characterise leafhopper stress on cotton, identify sensitive bands, and derive hyperspectral vegetation indices specific to this pest. Cotton plants with varying levels of LH severity were selected from three locations across major cotton growing regions of India. About 57–58 cotton plants from each location exhibiting different levels of LH damage symptoms were selected. Reflectance measurements in the spectral range of 350 – 2500 nm were made using hyperspectral radiometer. Simultaneously chlorophyll (Chl) and relative water content (RWC) were also estimated from the selected plants. Reflectance from healthy and leafhopper infested plants showed a significant difference in VIS and NIR regions. Decrease in Chla pigment was more significant than Chlb in the infested plants and the ratio of Chla/b showed a decreasing trend with increase in LH severity. Regression analysis revealed a significant linear relation between LH severity and Chl (R2 = 0.505), and a similar fit was also observed for RWC (R2 = 0.402). Plotting linear intensity curves between reflectance at each waveband with infestation grade resulted in six sensitive bands that exhibited maximum correlation at different regions of the electromagnetic spectrum (376, 496, 691, 761, 1124 and 1457 nm). Regression analysis of several ratio indices formulated with two or more of these sensitive bands led to the identification of new leaf hopper indices (LHI) with a potential to detect leafhopper severity. These new indices along with 20 other stress related hyperspectral indices compiled from literature were further tested for their ability to detect LH severity. Two novel indices LHI 2 and LHI 4 proposed in this study showed significantly high coefficients of determination across locations (R2 range 0.521 to 0.825) and hence have the potential use for detection of leafhopper severity in cotton. Prabhakar, et al., 2011, Computers and Electronics in Agriculture, 79:189-198. 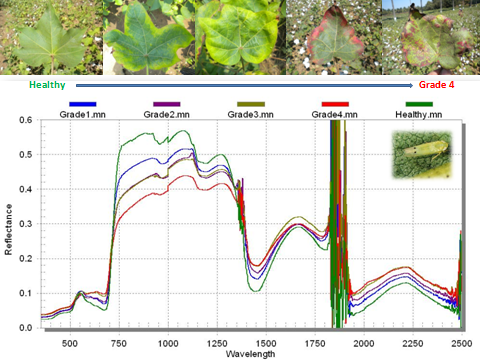 Phenacoccus solenopsis Tinsley, a native of North America, is a widespread exotic mealybug infesting cotton, Gossypium spp. in several countries. Monitoring of this pest is generally undertaken through regular field surveys, which is labour intensive, time consuming and error prone. Alternately, radiometry is a reliable technique for rapid and non-destructive assessment of plant health. Thus, a study was conducted to characterize reflectance spectra of cotton plants with known mealybug infestation levels (grade-0 is healthy and grade-4 is severe), and seek to identify specific narrow wavelengths sensitive to mealybug damage. Reflectance measurements were made in the spectral range of 350–2500 nm using a hyperspectral radiometer. Significant differences were found in green, near infrared and short wave infrared spectral regions for plants with early stages of P. solenopsis infestation, and for plants showing higher grades of infestation these differences extended to all the regions except blue. A significant reduction in total chlorophyll (12.83–35.83%) and relative water content (1.93–23.49%) was observed in the infested plants. Reflectance sensitivity analysis of the hyperspectral data revealed wavelengths centered at 492, 550, 674, 768 and 1454 nm as most sensitive to mealybug damage. Mealybug Stress Indices (MSIs) were developed using two or three wavelengths, tested using multinomial logistic regression (MLR) analysis and compared with other indices published earlier. Results showed that the MSIs were superior (R2 = 0.82) to all other spectral vegetation indices tested. Further, the proposed MLR models corresponding to each MSIs were validated using two independent field data sets. The overall percent correct classification of cotton plants into different mealybug damage severity grades was in the range of 38.3 and 54.9. High classification accuracy for grade-1 (81.8%) showed that models are capable of early detection of mealybug damage. Results of this study could suggest potential usage of remote sensing in monitoring spatial and temporal distribution of the solenopsis mealybug, and thereby enable effective planning and implementation of site-specific pest management practices. Prabhakar, et al., 2013, Computers and Electronics in Agriculture, 97:61-70. 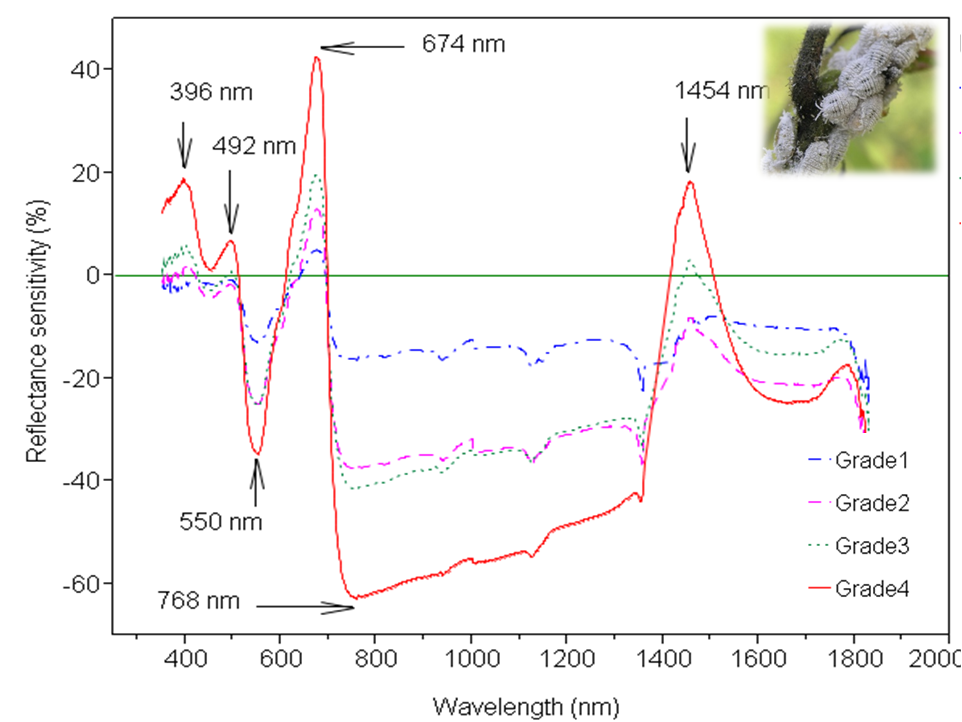 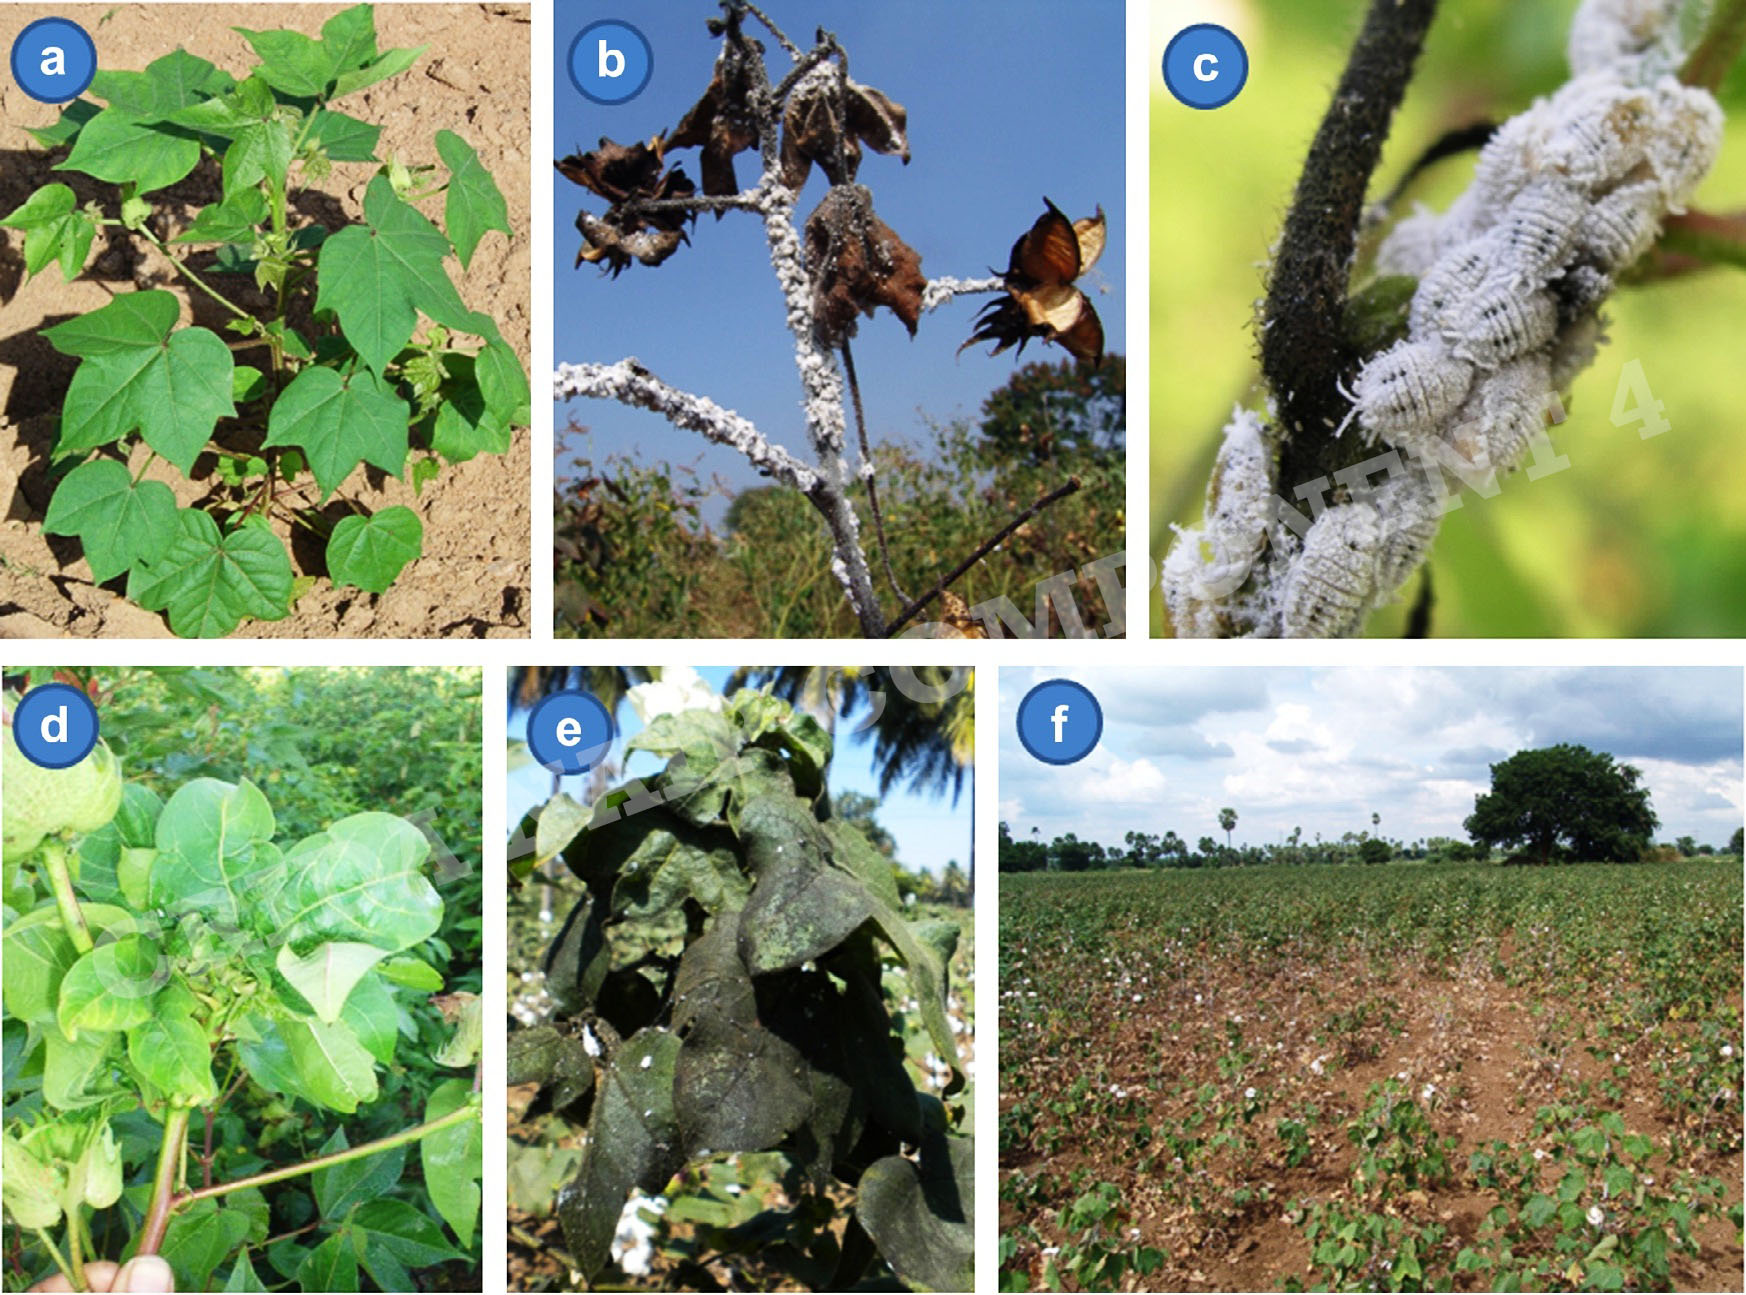 There was an outbreak of rice leaf folder in 3 districts viz., Kaithal, Karnal and Kurukshethra of Haryana during kharif 2012. The predominant basmati types grown in the area were CSR 30 and Pusa 1121 and the damage level in farmers field was 10-80%. Spectral characterization of rice leaf folder damage was done using Fieldspec-3 hyper-spectral radiometer in several naturally infested farmers’ fields at Kaul, Haryana in 2012. The data was used in multi-logistic regression analysis and identified five sensitive bands in the range of 330 to 1460 nm. Principle component analysis was performed to identify optimum combination of the sensitive bands. Identified PCs were used to build multi-logistic regression models for assessing leaf folder severity in rice. Extensive ground truthing was done in Kaul, Kurukshetra and Kaithal tehsils of Haryana in the previous season. Further, satellite data of IRS-P6, LISS-4 was procured for this period and supervised classification of leaf folder damage and crop condition was first attempted. Further, we now performed spectral un-mixing analysis to generate maps with different levels of leaf folder damage. Attempts are under way to map leaf folder damage using unsupervised classification of the satellite data. 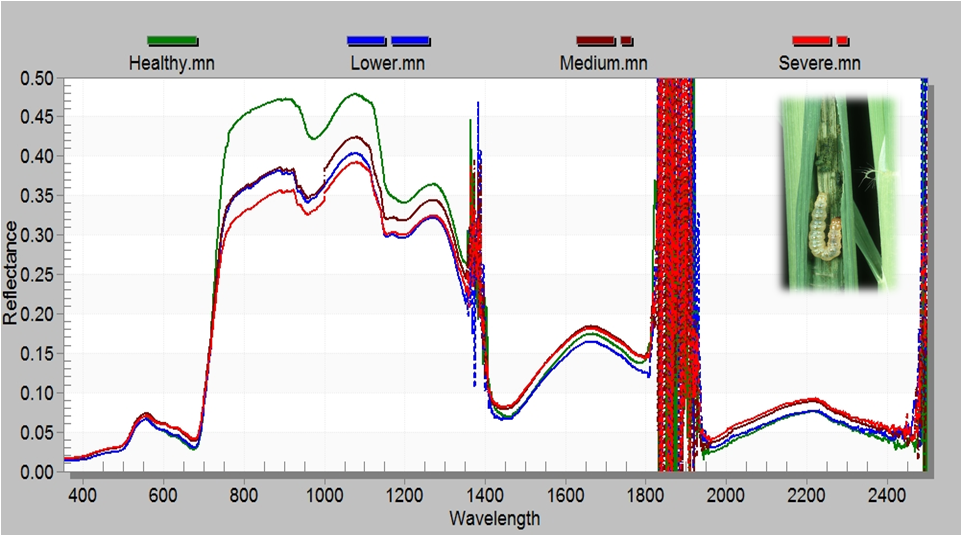 There was an outbreak of rice brown planthopper at Nalgonda district of Andhra Pradesh during Kharif 2013. The predominant rice varieties grown in the area was BPT 5204 and the damage level in farmers field was 10-100%. Spectral characterization for BPH damage in rice (rice-rice cropping system) was recorded by using hyperspectral radiometer. Reflectance spectra from BPH affected plants showed a sharp decline in visible and NIR regions. 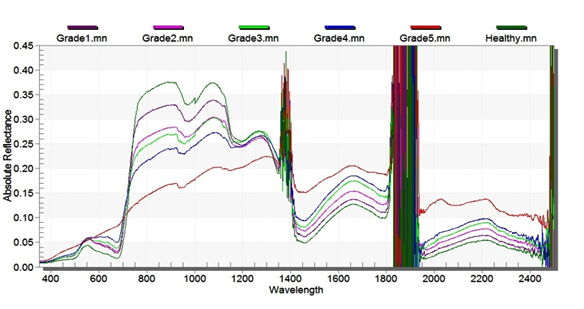 |